BubbleChartReport
BubbleChartReport
/**
* DynamicReports - Free Java reporting library for creating reports dynamically
*
* Copyright (C) 2010 - 2018 Ricardo Mariaca
* https://dynamicreports.lbayer.com
*
* This file is part of DynamicReports.
*
* DynamicReports is free software: you can redistribute it and/or modify
* it under the terms of the GNU Lesser General Public License as published by
* the Free Software Foundation, either version 3 of the License, or
* (at your option) any later version.
*
* DynamicReports is distributed in the hope that it will be useful,
* but WITHOUT ANY WARRANTY; without even the implied warranty of
* MERCHANTABILITY or FITNESS FOR A PARTICULAR PURPOSE. See the
* GNU Lesser General Public License for more details.
*
* You should have received a copy of the GNU Lesser General Public License
* along with DynamicReports. If not, see <http://www.gnu.org/licenses/>.
*/
package net.sf.dynamicreports.examples.chart;
import static net.sf.dynamicreports.report.builder.DynamicReports.*;
import net.sf.dynamicreports.examples.Templates;
import net.sf.dynamicreports.report.builder.column.TextColumnBuilder;
import net.sf.dynamicreports.report.builder.style.FontBuilder;
import net.sf.dynamicreports.report.datasource.DRDataSource;
import net.sf.dynamicreports.report.exception.DRException;
import net.sf.jasperreports.engine.JRDataSource;
/**
* @author Ricardo Mariaca (r.mariaca@dynamicreports.org)
*/
public class BubbleChartReport {
public BubbleChartReport() {
build();
}
private void build() {
FontBuilder boldFont = stl.fontArialBold().setFontSize(12);
TextColumnBuilder<Double> xColumn = col.column("X", "x", type.doubleType());
TextColumnBuilder<Double> y1Column = col.column("Y1", "y1", type.doubleType());
TextColumnBuilder<Double> z1Column = col.column("Z1", "z1", type.doubleType());
TextColumnBuilder<Double> y2Column = col.column("Y2", "y2", type.doubleType());
TextColumnBuilder<Double> z2Column = col.column("Z2", "z2", type.doubleType());
try {
report()
.setTemplate(Templates.reportTemplate)
.columns(xColumn, y1Column, z1Column, y2Column, z2Column)
.title(Templates.createTitleComponent("BubbleChart"))
.summary(
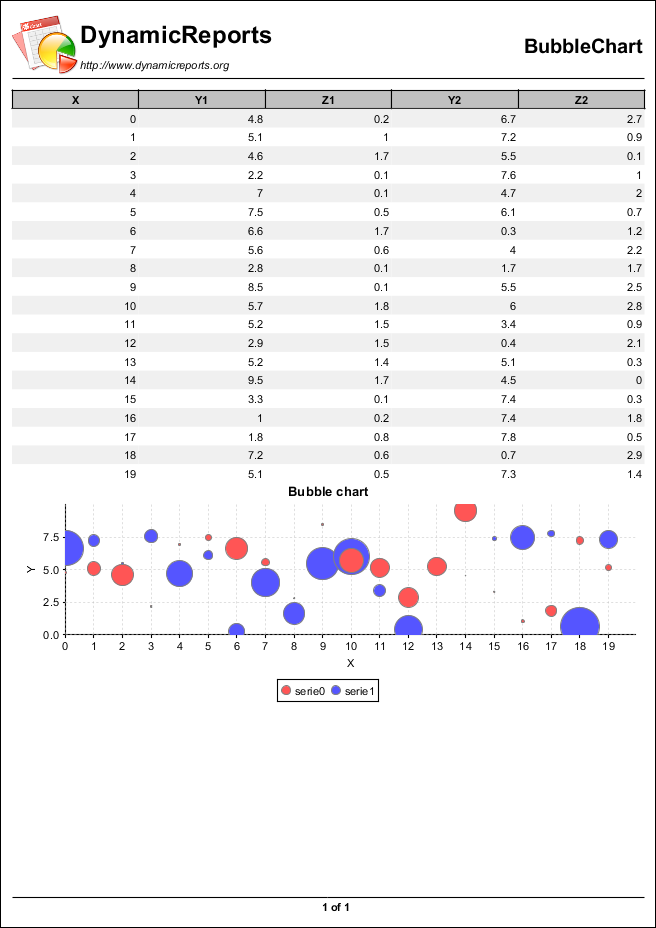
cht.bubbleChart()
.setTitle("Bubble chart")
.setTitleFont(boldFont)
.setXValue(xColumn)
.series(
cht.xyzSerie().setYValue(y1Column).setZValue(z1Column),
cht.xyzSerie().setYValue(y2Column).setZValue(z2Column))
.setXAxisFormat(
cht.axisFormat().setLabel("X"))
.setYAxisFormat(
cht.axisFormat().setLabel("Y")))
.pageFooter(Templates.footerComponent)
.setDataSource(createDataSource())
.show();
} catch (DRException e) {
e.printStackTrace();
}
}
private JRDataSource createDataSource() {
DRDataSource dataSource = new DRDataSource("x", "y1", "z1", "y2", "z2");
for (int i = 0; i < 20; i++) {
dataSource.add((double) i, Math.random() * 10, Math.random() * 2, Math.random() * 8, Math.random() * 3);
}
return dataSource;
}
public static void main(String[] args) {
new BubbleChartReport();
}
}