Version 5.1.0
![]()
Documentation & examples
Support
Project info
Links
Getting started
Table of contents
Overview
Creating a report with DynamicReports is very easy, take a look at the example below
import static net.sf.dynamicreports.report.builder.DynamicReports.*;
  public class Report {

    private void build() {
      try {
        report()//create new report design
          .columns(...) //adds columns
          .groupBy(...) //adds groups
          .subtotalsAtSummary(...) //adds subtotals
          ...
          //set datasource
          .setDataSource(...)
          //export report
          .toPdf(...) //export report to pdf
          .toXls(...) //export report to excel
          ...
          //other outputs
          .toJasperPrint() //creates jasperprint object
          .show() //shows report
          .print() //prints report
          ...
      } catch (DRException e) {
        e.printStackTrace();
      }
    }
    ...
  }
See ReportBuilder class for all available features and JasperReportBuilder class for all available exports and outputs
Simple report
Please note that this is a tutorial example and that this tutorial doesn't describe all features!
You will learn in this section how to create a simple report step by step.
First we need to create an empty report desing, configure it and set a datasource. Afterwards the report will be ready to export into any format.
It's important to remember the DynamicReports class, through which you will have available most of features. The class provides methods for building a particular piece of a report.
Let's start!
Step 1 : Start
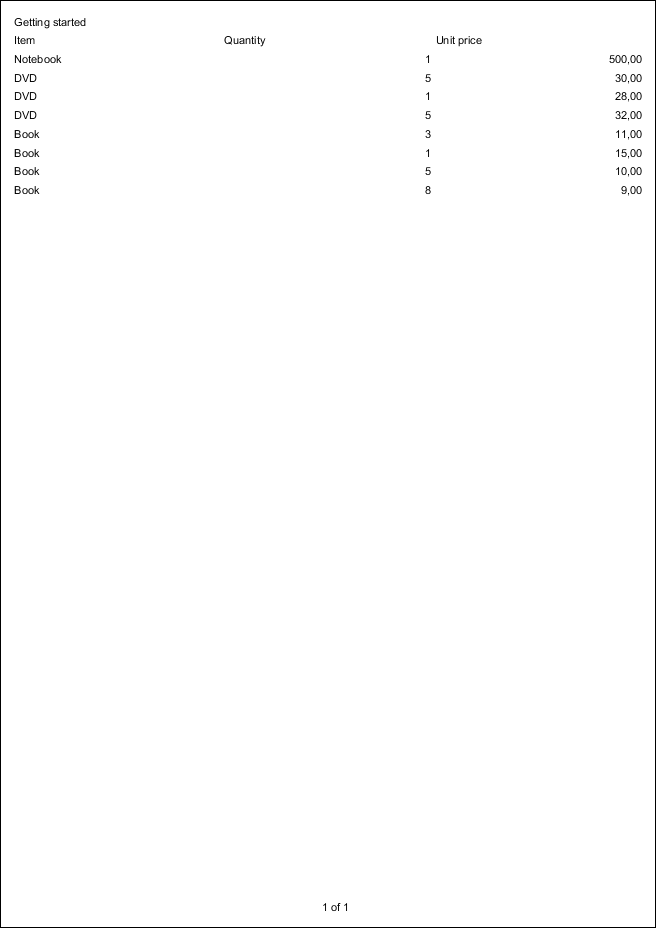
First define columns through DynamicReports.col.column(title, field name, datatype) (the field name must match with the name of a field contained in the datasource) and pass them into the report as follows:
  .columns(//add columns
    //             title,     field name     data type
    col.column("Item",       "item",      type.stringType()),
    col.column("Quantity",   "quantity",  type.integerType()),
    col.column("Unit price", "unitprice", type.bigDecimalType()))
now define some text at the title and number of pages at the page footer as follows:
  .title(cmp.text("Getting started"))//shows report title
  .pageFooter(cmp.pageXofY())//shows number of page at page footer
DynamicReports.cmp.text(some text) - creates a component that shows a text
DynamicReports.cmp.pageXofY() - creates a component that shows page X of Y
Methods title(...) and pageFooter(...) allows to customize a particular report band by adding components to it
|
|
SimpleReport_Step01 |
Step 2 : Styles
Each style can have a parent style from which it will inherit its properties. Empty style can be created by DynamicReports.stl.style()
  StyleBuilder boldStyle         = stl.style().bold();
  StyleBuilder boldCenteredStyle = stl.style(boldStyle)
                                      .setHorizontalAlignment(HorizontalAlignment.CENTER);
  StyleBuilder columnTitleStyle  = stl.style(boldCenteredStyle)
                                      .setBorder(stl.pen1Point())
                                      .setBackgroundColor(Color.LIGHT_GRAY);
  report()
    .setColumnTitleStyle(columnTitleStyle)
    .highlightDetailEvenRows()
    .title(cmp.text("Getting started").setStyle(boldCenteredStyle))
    .pageFooter(cmp.pageXofY().setStyle(boldCenteredStyle))

|
|
SimpleReport_Step02 |
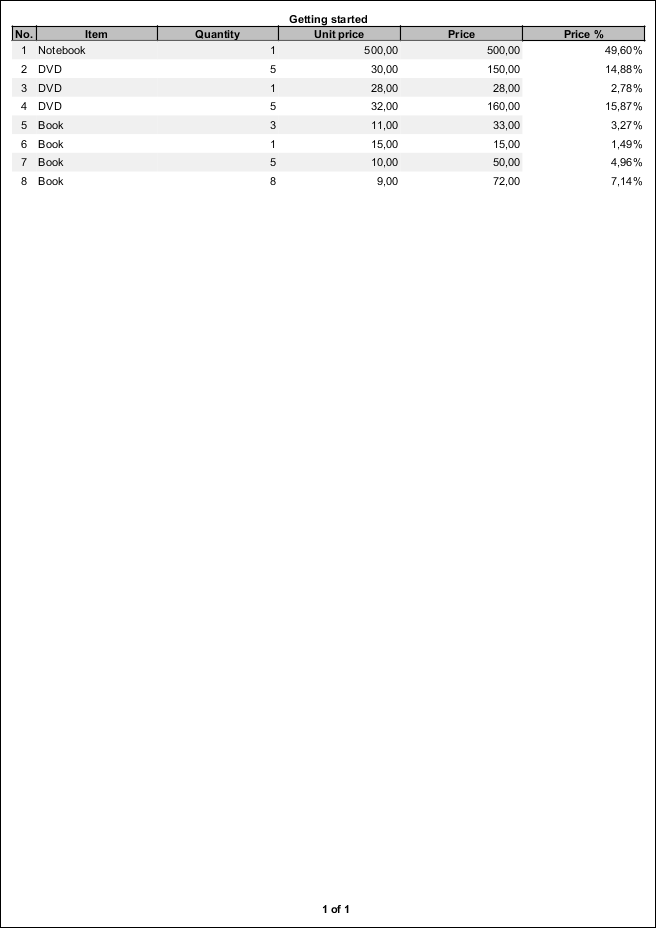
Step 3 : Additional columns
You can very easy multiply, divide, add or subtract column of numbers by another column of numbers or by a number value
  //price = unitPrice * quantity
  TextColumnBuilder<BigDecimal> priceColumn = unitPriceColumn.multiply(quantityColumn)
                                                             .setTitle("Price");
Adding percentage of any column of numbers is simple DynamicReports.col.percentageColumn(title, column)
PercentageColumnBuilder pricePercColumn = col.percentageColumn("Price %", priceColumn);
DynamicReports.col.reportRowNumberColumn(title) creates a column that shows row number
  TextColumnBuilder<Integer> rowNumberColumn =
      col.reportRowNumberColumn("No.")
      //sets the fixed width of a column, width = 2 * character width
      .setFixedColumns(2)
      .setHorizontalAlignment(HorizontalAlignment.CENTER);
|
|
SimpleReport_Step03 |
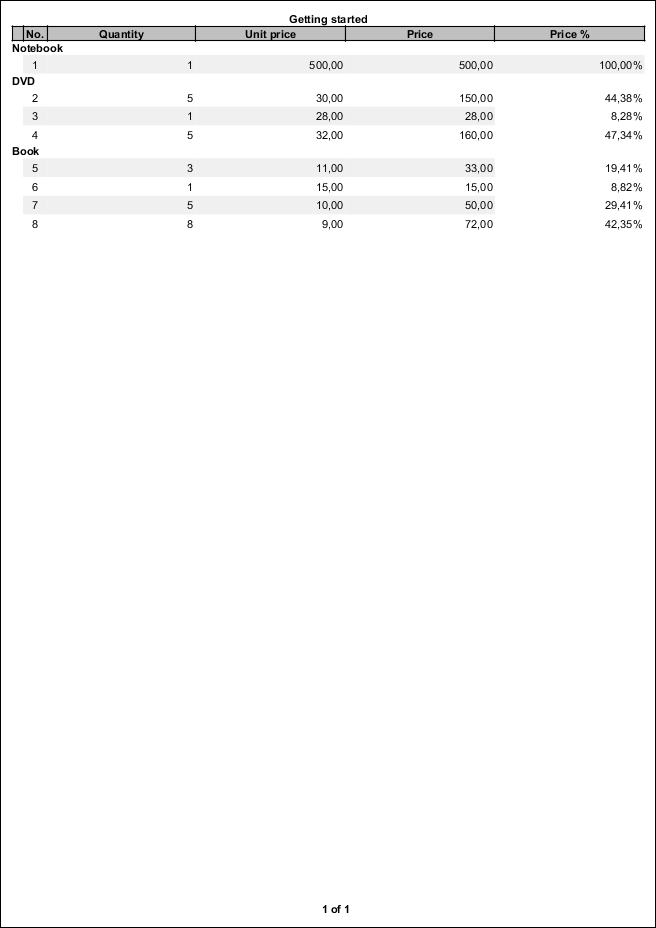
Step 4 : Group
We continue by adding a group as shown below
.groupBy(itemColumn)
|
|
SimpleReport_Step04 |
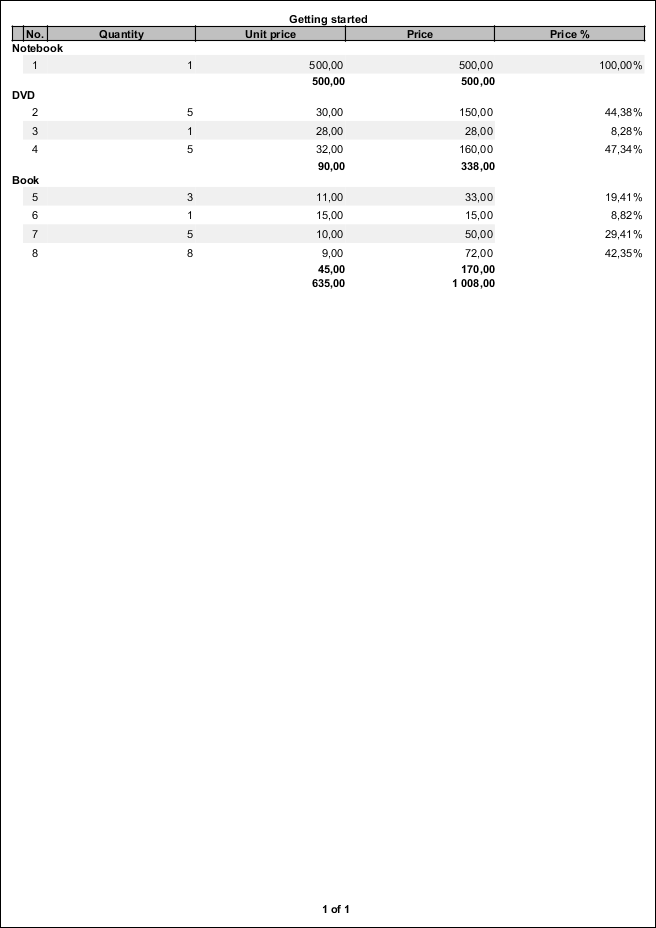
Step 5 : Subtotals
Now we can try to sum a column of numbers. Subtotal of sum is created through DynamicReports.sbt.sum(column)
  .subtotalsAtSummary(
        sbt.sum(unitPriceColumn), sbt.sum(priceColumn))
  .subtotalsAtFirstGroupFooter(
        sbt.sum(unitPriceColumn), sbt.sum(priceColumn))
Method subtotalsAtSummary(...) allows to add subtotals to the summary band
Method subtotalsAtFirstGroupFooter(...) will find first defined group and add subtotals to the group footer band
|
|
SimpleReport_Step05 |
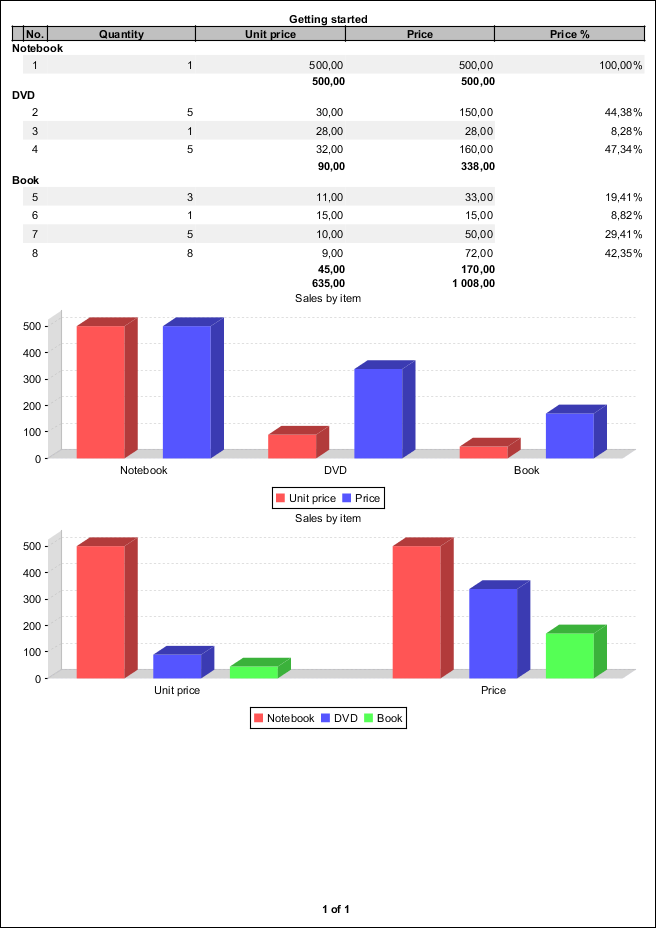
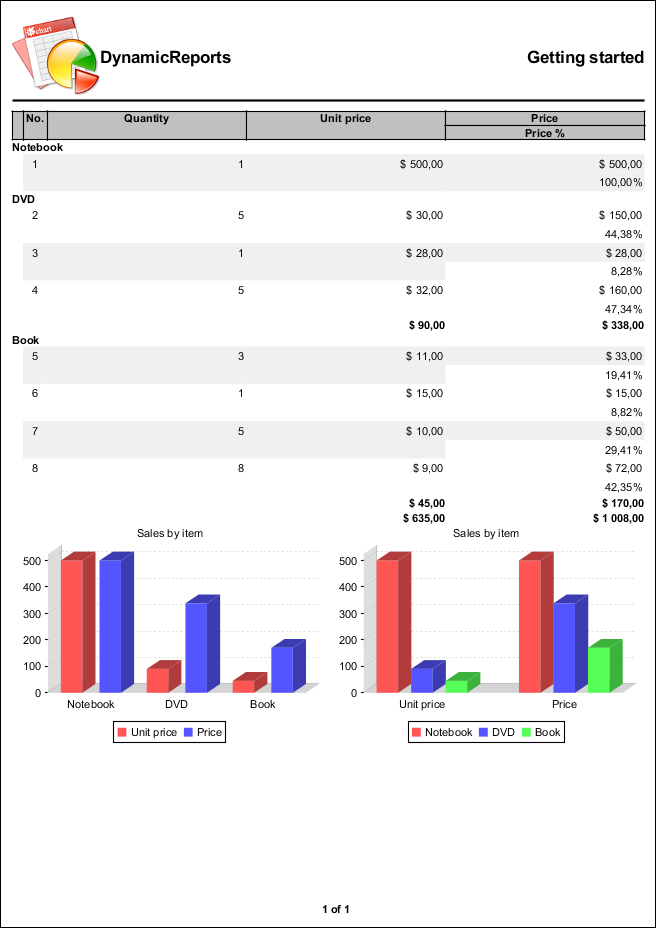
Step 6 : Charts
DynamicReports.cht provide methods for building charts. Category and series are required.
  Bar3DChartBuilder itemChart = cht.bar3DChart()
                                   .setTitle("Sales by item")
                                   .setCategory(itemColumn)
                                   .addSerie(
                                      cht.serie(unitPriceColumn), cht.serie(priceColumn));
  Bar3DChartBuilder itemChart2 = cht.bar3DChart()
                                   .setTitle("Sales by item")
                                   .setCategory(itemColumn)
                                   .setUseSeriesAsCategory(true)
                                   .addSerie(
                                     cht.serie(unitPriceColumn), cht.serie(priceColumn));
Chart is a component and can be placed into any report band.
.summary(itemChart, itemChart2)
|
|
SimpleReport_Step06 |
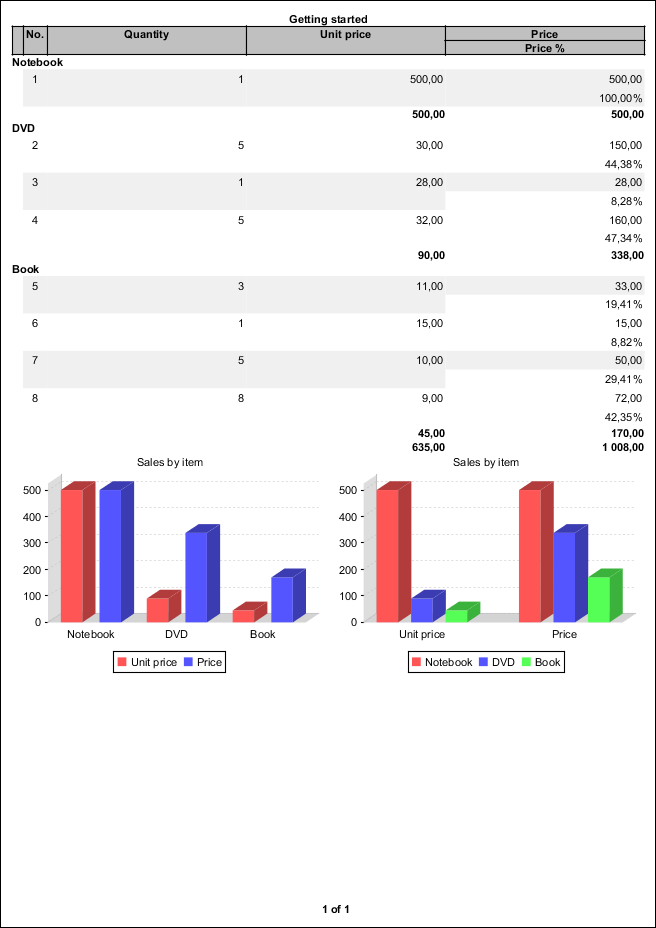
Step 7 : Column grid & Containers
Components inserted into the bands are arranged vertically, each component is below the previously added component. To arrange components horizontally it is needed to wrap these components with a horizontal container. Container is a component as well and therefore it can be added to any of the report bands.
  .summary(
      cmp.horizontalList(itemChart, itemChart2))
Columns layout can be modified by a column grid. The layout is applied to the columns title, details and subtotals.
  .columnGrid(
      rowNumberColumn, quantityColumn, unitPriceColumn,
      grid.verticalColumnGridList(priceColumn, pricePercColumn))
|
|
SimpleReport_Step07 |
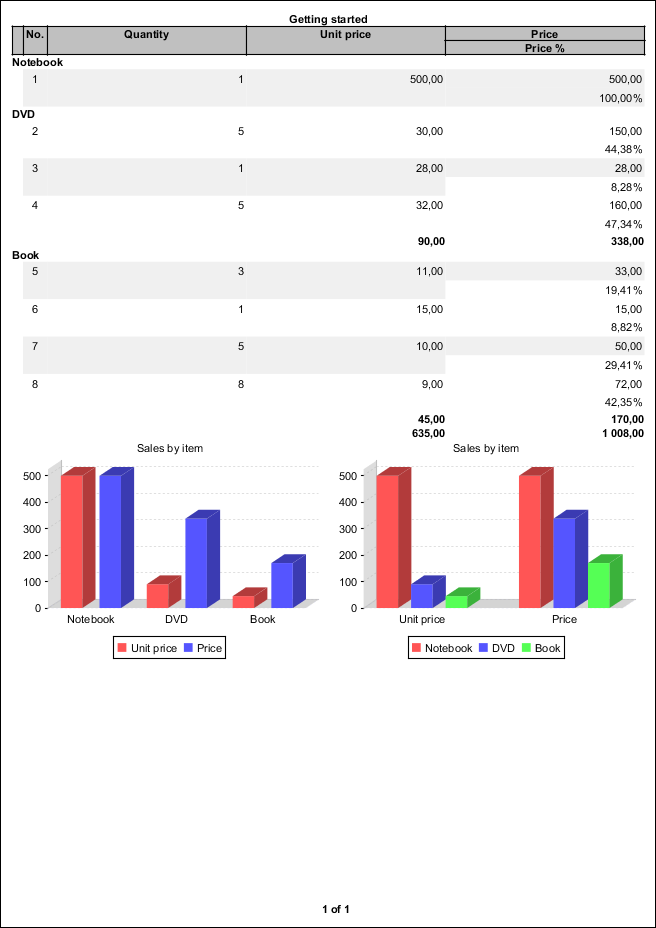
Step 8 : Hide subtotal
Subtotal for the group notebook is unnecessary because contains only one row.
We need to change the group declaration and set the boolean expression condition on which depends whether subtotal is printed.
DynamicReports.exp.printWhenGroupHasMoreThanOneRow(itemGroup) creates a boolean condition which returns true when itemGroup has more than one row.
  ColumnGroupBuilder itemGroup = grp.group(itemColumn);
  itemGroup.setPrintSubtotalsWhenExpression(
              exp.printWhenGroupHasMoreThanOneRow(itemGroup));
.groupBy(itemGroup)
|
|
SimpleReport_Step08 |
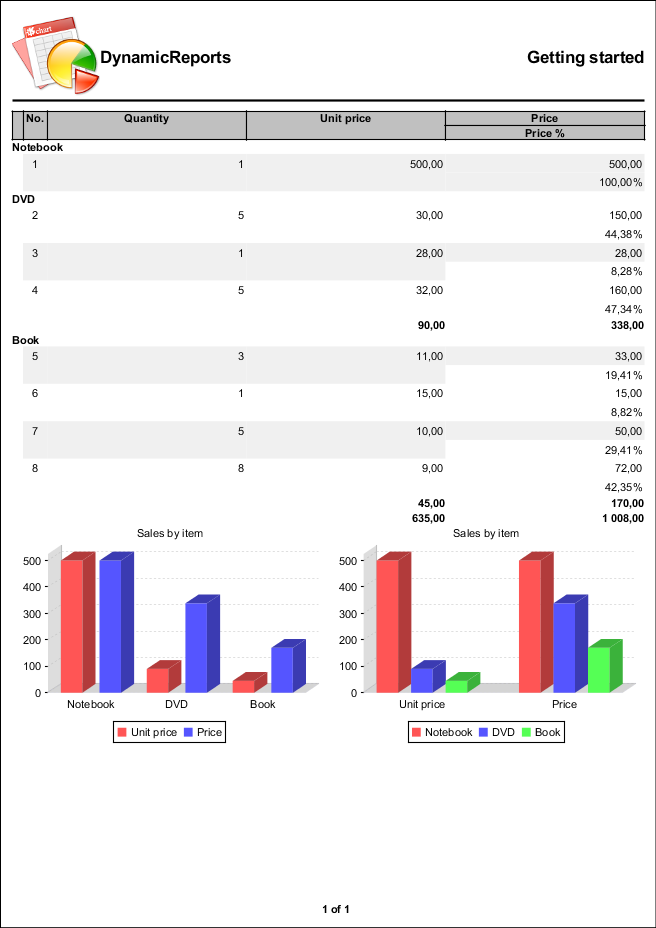
Step 9 : Title
First define a title style.
  StyleBuilder titleStyle = stl.style(boldCenteredStyle)
                               .setVerticalAlignment(VerticalAlignment.MIDDLE)
                               .setFontSize(15);
DynamicReports.cmp.image() creates an image component
DynamicReports.cmp.filler() creates an empty component
  .title(//shows report title
       cmp.horizontalList()
    .add(
      cmp.image(getClass().getResourceAsStream("../images/dynamicreports.png")).setFixedDimension(80, 80),
      cmp.text("DynamicReports").setStyle(titleStyle).setHorizontalAlignment(HorizontalAlignment.LEFT),
      cmp.text("Getting started").setStyle(titleStyle).setHorizontalAlignment(HorizontalAlignment.RIGHT))
    .newRow()
    .add(cmp.filler().setStyle(stl.style().setTopBorder(stl.pen2Point())).setFixedHeight(10)))
The defined filler creates an additional blank space between the title and the column header.
Setting top border of a filler draws the line at the bottom of the title.
Horizontal list, as previously mentioned, arranges components horizontally in one row but by calling the method row() a new horizontal list is created which is located at the bottom of the previous horizontal list.
|
|
SimpleReport_Step09 |
Step 10 : Currency data type
Unit price and price column are currency types.
Showing currency is possible by setting pattern to both columns (via method setPattern()), but the best practice is to create a custom data type and apply it to the columns. The custom data type then can be used in other reports.
  CurrencyType currencyType = new CurrencyType();
  TextColumnBuilder<BigDecimal> unitPriceColumn = col.column("Unit price", "unitprice", currencyType);
  //price = unitPrice * quantity
  TextColumnBuilder<BigDecimal> priceColumn     = unitPriceColumn.multiply(quantityColumn).setTitle("Price")
                                                                 .setDataType(currencyType);
  private class CurrencyType extends BigDecimalType {
    private static final long serialVersionUID = 1L;

    @Override
    public String getPattern() {
      return "$ #,###.00";
    }
  }
|
|
SimpleReport_Step10 |
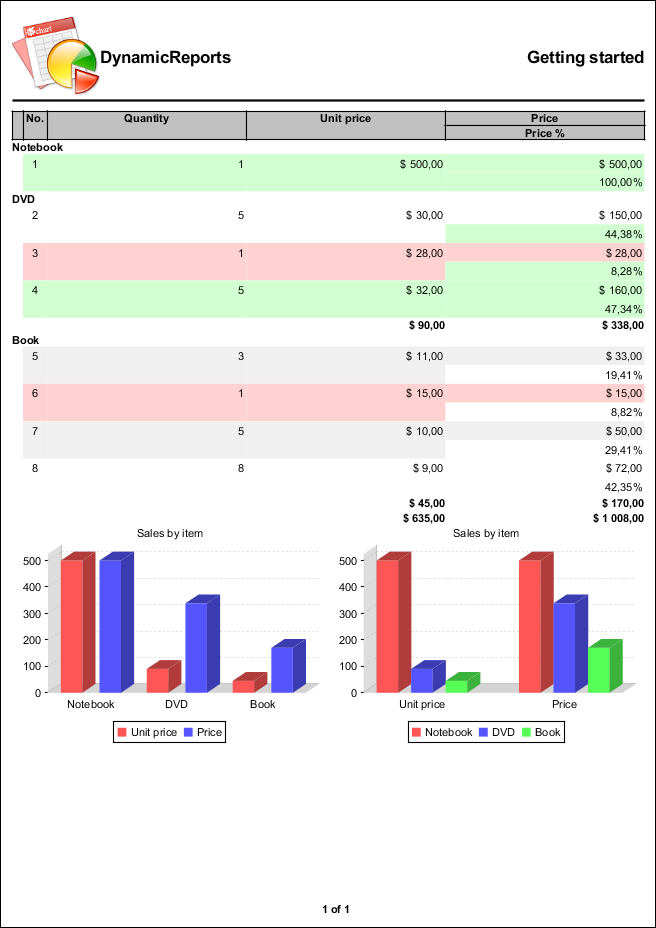
Step 11 : Detail row highlighters
  ConditionalStyleBuilder condition1 = stl.conditionalStyle(cnd.greater(priceColumn, 150))
                                          .setBackgroundColor(new Color(210, 255, 210));
  ConditionalStyleBuilder condition2 = stl.conditionalStyle(cnd.smaller(priceColumn, 30))
                                          .setBackgroundColor(new Color(255, 210, 210));
  .detailRowHighlighters(
    condition1, condition2)
Condition1 is applied only if price is greater than 150 and sets background color of a row to green.
Condition2 is applied only if price is smaller than 30 and sets background color of a row to red.
|
|
SimpleReport_Step11 |
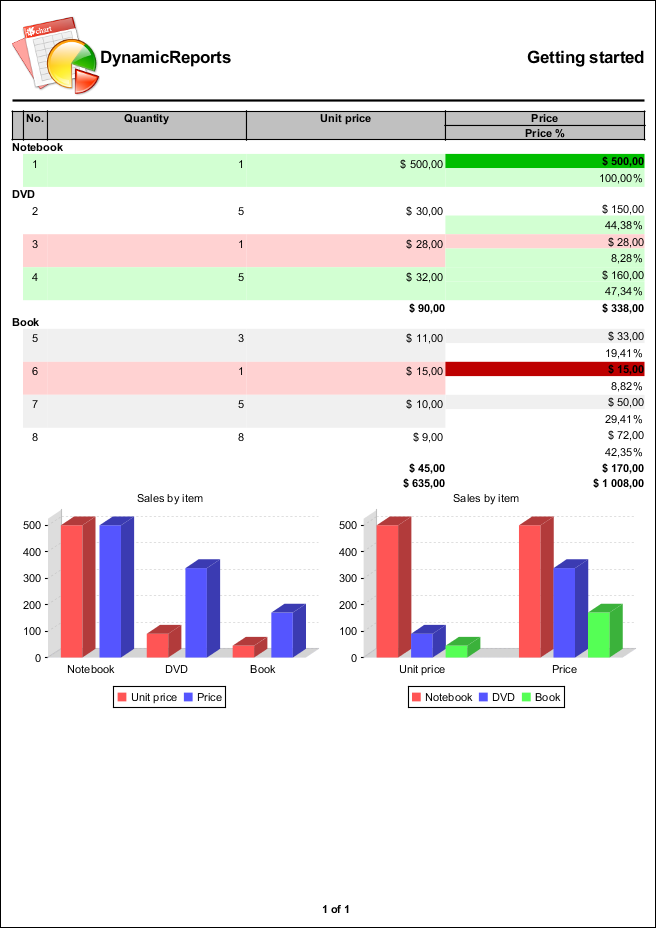
Step 12 : Conditional styles
  ConditionalStyleBuilder condition3 = stl.conditionalStyle(cnd.greater(priceColumn, 200))
                                          .setBackgroundColor(new Color(0, 190, 0))
                                          .bold();
  ConditionalStyleBuilder condition4 = stl.conditionalStyle(cnd.smaller(priceColumn, 20))
                                          .setBackgroundColor(new Color(190, 0, 0))
                                          .bold();
  StyleBuilder priceStyle = stl.style()
                               .conditionalStyles(
                                 condition3, condition4);
  priceColumn = unitPriceColumn.multiply(quantityColumn).setTitle("Price")
                         .setDataType(currencyType)
                         .setStyle(priceStyle);
Condition3 is applied only if price is greater than 200 and sets background color of a price to green.
Condition4 is applied only if price is smaller than 20 and sets background color of a price to red.
|
|
SimpleReport_Step12 |
Latest News
-
ThuJan25Changes in version 5.1.0 upgrade to JasperReports 6.5.1 removed xhtml and excelapi exporter removed thread safety...
-
FriJan27Changes in version 5.0.0 upgrade to JasperReports 6.4.0 upgrade to Java 1.7, DynamicReports is no longer compatibl...
-
ThuJul28Changes in version 4.1.1 upgrade to JasperReports 6.2.2 added new types of component stretch type minor bug fixes...
