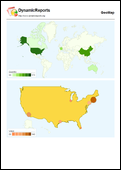
GeoMapReport
GeoMapReport
/**
 * DynamicReports - Free Java reporting library for creating reports dynamically
 *
 * Copyright (C) 2010 - 2018 Ricardo Mariaca
 * https://dynamicreports.lbayer.com
 *
 * This file is part of DynamicReports.
 *
 * DynamicReports is free software: you can redistribute it and/or modify
 * it under the terms of the GNU Lesser General Public License as published by
 * the Free Software Foundation, either version 3 of the License, or
 * (at your option) any later version.
 *
 * DynamicReports is distributed in the hope that it will be useful,
 * but WITHOUT ANY WARRANTY; without even the implied warranty of
 * MERCHANTABILITY or FITNESS FOR A PARTICULAR PURPOSE. See the
 * GNU Lesser General Public License for more details.
 *
 * You should have received a copy of the GNU Lesser General Public License
 * along with DynamicReports. If not, see <http://www.gnu.org/licenses/>.
 */

package net.sf.dynamicreports.examples.googlechart;

import static net.sf.dynamicreports.report.builder.DynamicReports.*;

import java.awt.Color;

import net.sf.dynamicreports.examples.Templates;
import net.sf.dynamicreports.googlecharts.report.GoogleCharts;
import net.sf.dynamicreports.googlecharts.report.geomap.GeoMapBuilder;
import net.sf.dynamicreports.googlecharts.report.geomap.GeoMapDataMode;
import net.sf.dynamicreports.jasper.builder.export.JasperHtmlExporterBuilder;
import net.sf.dynamicreports.report.datasource.DRDataSource;
import net.sf.dynamicreports.report.exception.DRException;
import net.sf.jasperreports.engine.JRDataSource;

/**
 * @author Ricardo Mariaca (r.mariaca@dynamicreports.org)
 *
 *         GeoMap component works only for html export.
 *         Visit the following link for more information about geo map parameters
 *         http://code.google.com/apis/chart/interactive/docs/gallery/geomap.html
 */
public class GeoMapReport {

	public GeoMapReport() {
		build();
	}

	private void build() {
		GeoMapBuilder geoMap1 = GoogleCharts.geoMap()
				.setDataSource(createDataSource1())
				.setLocation("location", String.class)
				.setValue("quantity", Integer.class)
				.setLabel("label", String.class)
				.setValueLabel("Quantity")
				.setFixedHeight(300);

		GeoMapBuilder geoMap2 = GoogleCharts.geoMap()
				.setDataSource(createDataSource2())
				.setDataMode(GeoMapDataMode.MARKERS)
				.setRegion("US")
				.colors(Color.decode("#FF8747"), Color.decode("#FFB581"), Color.decode("#C06000"))
				.setLocation("location", String.class)
				.setValue("quantity", Integer.class)
				.setFixedHeight(300);

		try {
			JasperHtmlExporterBuilder htmlExporter = export.htmlExporter("c:/report.html")
					.setImagesDirName("c:/images")
					.setOutputImagesToDir(true);

			report()
					.setTemplate(Templates.reportTemplate)
					.title(Templates.createTitleComponent("GeoMap"))
					.summary(
							geoMap1, cmp.verticalGap(10), geoMap2)
					.toHtml(htmlExporter);
		} catch (DRException e) {
			e.printStackTrace();
		}
	}

	private JRDataSource createDataSource1() {
		DRDataSource dataSource = new DRDataSource("location", "quantity", "label");
		dataSource.add("US", 170, "United States");
		dataSource.add("CA", 90, "Canada");
		dataSource.add("FR", 120, "France");
		dataSource.add("AU", 100, "Australia");
		dataSource.add("CN", 150, "China");
		return dataSource;
	}

	private JRDataSource createDataSource2() {
		DRDataSource dataSource = new DRDataSource("location", "quantity");
		dataSource.add("New York", 110);
		dataSource.add("Boston", 140);
		dataSource.add("Miami", 80);
		dataSource.add("Chicago", 90);
		dataSource.add("Los Angeles", 120);
		dataSource.add("Houston", 100);
		return dataSource;
	}

	public static void main(String[] args) {
		new GeoMapReport();
	}
}

